Agriculture caused revolutionary changes in the course of human history. And so-called the art of cultivating plants is still a fundament for the world. We strive to improve its every aspect, but constant climate changes and uncontrollable variables make the task complex.
However, before we undertake any action, it is crucial to observe and understand particular phenomena. We have already given considerable attention to agriculture in our earlier articles. Nevertheless, science and continuous progress of researchers brought to light new conclusions.
In this article, we introduce you to the more complex and detailed observation of plants. It will serve as a basis for the presentation of more practical application in the following articles.
While practically every living organism generates at least some heat, their temperature serves us as an indicator and a source of useful information. For this kind of observation, Thermal Imaging is an ideal tool, often essential.
Recently, a group of Spanish academics (Mónica Pineda, Matilde Barón and María-Luisa Pérez-Bueno) reviewed Thermal Imaging technology for plant stress detection and phenotyping. Some general but impactful reasons behind the research were economic losses in agriculture caused by increasing environmental pressures that could reach an annual 0.3% to 0.8% of projected global gross domestic product by the end of the century. Moreover, plant diseases are the main cause of the drop in production and economic losses in agriculture worldwide, reaching yield losses of 20 to 30% depending on the crop. These heavy loses of resources motivate us to look for optimizations.
For anyone not involved in the topic, plant phenotyping based on imaging techniques is a pertinent approach to quantify the appearance and performance of crops under different environmental conditions while addressing the spatial heterogeneity of crop fields. Plant phenotyping, applied to precision agriculture, is a valuable tool for the diagnosis and detection of plant stress, even in the absence of symptoms.
Stomatal activity is one of the most important physiological traits for plant growth and development. It plays a crucial role in the carbon and water balance by controlling photosynthesis and transpiration. Hence, stomatal conductance to water (gs) is related to yield and to the tolerance of environmental stresses and correlates strongly with leaf temperature. Thus, conventional, time-consuming ground-based gs measurements can be feasibly replaced by thermal images evaluating plant physiological status at different scales in short periods. Additionally, highly sensitive thermal cameras with a relatively simple operational procedure have become more available to research groups, at a lower cost and higher spatial resolution. Moreover, Thermal Imaging is a very valuable method of stress detection before the appearance of symptoms since it operates out of the visual range of the spectrum. However, some considerations must be taken when interpreting thermograms in terms of gs since plant surface temperature is mainly driven by environmental factors such as air temperature and relative humidity. Even though high-end thermal cameras carry out corrections for these two parameters, there are other factors affecting canopy temperatures, such as wind speed and light intensity, as well as by plant features, ranging from leaf size or angle to canopy structure. A number of corrections for these factors can be found in the literature as Thermal Imaging stress indices. Some of these parameters have been found to correlate with physiological traits related to the water balance status of plants. The most common TIR parameters are:
1. Normalized canopy or leaf temperature with reference to air temperature, utilized as an index of crop water status
2. Crop water stress index (CSWI), which introduces two baselines: (Tcanopy − Tair) wet as the estimated difference for a well-watered plant, and (Tcanopy – Tair )dry for a dry (non-transpiring) plant. CWSI is one of the most commonly used normalization methods for Thermal Imaging measurements, which overcomes the effects of other environmental parameters affecting plant temperature
3. Index of stomatal conductance (IG), since it is directly proportional to this parameter
4. Maximum temperature difference (MTD), calculated for every leaf or sample. This parameter has only been correlated with the severity of symptoms for several diseases
5. Normalized relative canopy temperature (NRCT), based on the maximum and the minimum temperature measured in the whole field trial. This parameter has been found to be a valid estimation of the crop water status
6. Average canopy temperature (Tav), based on maximum and minimum values of temperature, was one of the first parameters used by the conventional infrared thermography. However, this parameter can excessively simplify outcome data, and some important thermal information can be lost. Estimated shape factors derived by fitting the whole temperature data of the thermal images to the Weibull distribution could solve this constraint.
Despite the wide use of thermography applied to agronomy, this technique per se has a very limited capacity for diagnosis. Indeed, temperature raises may be due to stomatal closure, which is on its own an unspecific mechanism of plant defense against both abiotic and biotic stressors. Even more, temperature raises can also respond to a decreased capacity for water evaporation or even to the loss of vegetation. In contrast, some stresses can cause temporary decreases in leaf temperature. That would be the case of some pathogens that can interfere in the regulation of stomatal movements to favor their entry to the mesophyll. As a consequence, alterations in Thermal Imaging parameters stand as ambiguous clues for diagnosis. Moreover, abiotic stress factors (mostly drought, soil salinity or extreme ambient temperature) also cause increases in canopy temperature. This is most important under natural conditions, where abiotic stressors are difficult to assess and avoid. Keeping in mind that under such conditions, several stress factors often affect the vegetation simultaneously, possible misinterpretations of Thermal Imaging data would lead to inaccurate determination of the incidence and severity of a particular pathogen infection or even to a wrong diagnosis.
To overcome the restraints of thermography as a diagnostic technique, authors have increasingly applied it in combination with other imaging techniques. Roitsch et al. and Sperschneider reviewed the implementation of Thermal Imaging cameras with other sensors, such as RGB, multi- or hyperspectral cameras, in phenotyping platforms. The identification of spatial and temporal patterns of Thermal Imaging parameters in combination with other relevant vegetation indices (VIs) could be of great help to establish robust methods for the early diagnosis in crop fields. However, a preliminary analysis of a given plant-stressor interaction is desirable to obtain a stress-specific signature.
The use of complementary imaging techniques provides valuable and very complex information. This complexity is caused by the increasing number of dimensions that can be considered and the incessant improvements in their spatial and temporal resolution. To enhance our capacity for data analysis, most recent works have included data-mining in their analysis. This multidisciplinary approach, based on probability theory, statistics, decision theory, visualization and optimization, outperforms more conventional statistical analysis in terms of finding patterns in data. Classifiers are algorithms able to learn patterns from a database of known samples and, based on that knowledge, to identify or categorize new samples. When applied to agriculture, this approach facilitates the interpretation of data and the decision-making process to such an extent that no study appears to be complete without this type of analysis.
Thermography is extensively used for stress detection from lab to field scale by either proximal or remote sensing. On one hand, proximal sensing (mainly in growth chambers and greenhouses) refers to imaging single leaves or entire plants from a close distance to the target. The camera could be mounted on a static stand or small and medium-size robots, including high-throughput platforms. On the other hand, remote sensing refers to measurements taken in open fields with imaging sensors implemented on a wide range of devices, such as cranes, vehicles, robots and unmanned aerial vehicles (UAVs; in which the image resolution depends on the flight height) to cover whole crop fields. Even larger areas can be tackled thanks to the sensors onboard satellites (i.e. ASTER, Sentinel-3, ECOSTREES, or Landsat-7 and 8, among others). These sensors differ in their spatial resolution and also on the time resolution, depending on the revisiting frequency of the satellite over the particular area.
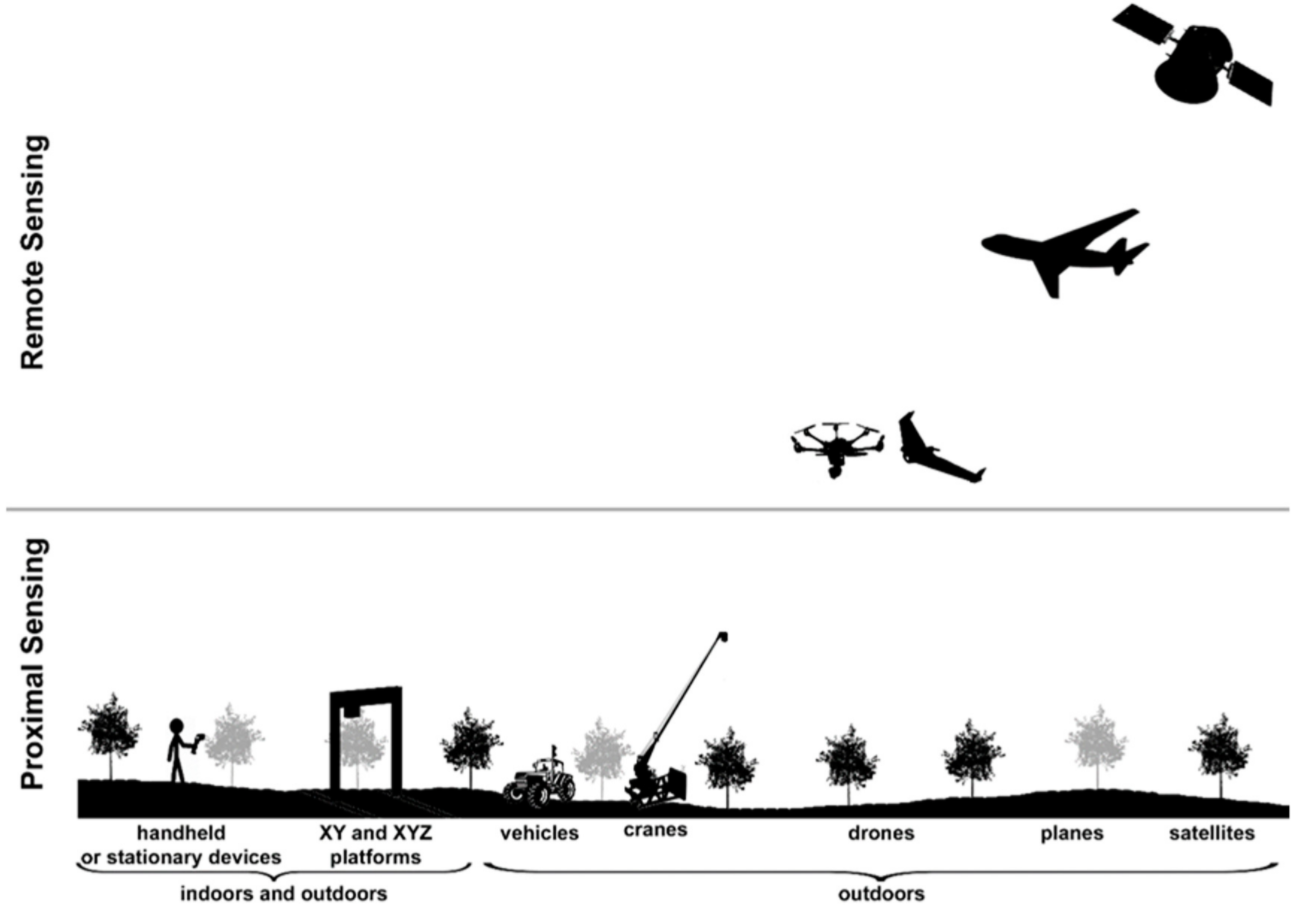
Pineda et al. (2021)
Despite the vast number of works addressing the use of thermography for plant stress detection, little attention has been paid to the physiological perspective of temperature alterations related to stressed plants. Attending to this need, this review will revise the most relevant applications of thermography to agriculture with the main aim of providing Thermal Imaging camera users with a collection of host plant–pathogen systems described in the literature in terms of thermal response and the mechanisms of plant defense involved.
I hope you enjoyed this introductory paper. Stay tuned as we will publish following material next week.
The article is based on “Thermal Imaging for Plant Stress Detection and Phenotyping” by Mónica Pineda, Matilde Barón and María-Luisa Pérez-Bueno (2021)
Articles' main image by IAPN (2019) https://www.iapn.de/en/news/news-details-print/what-plants-need-to-grow